Welcome to Algebra I: Calculating the Slope When Given Two Points
- 2x
- 1.75x
- 1.5x
- 1.25x
- 1x, selected
- 0.75x
- 0.5x
- Chapters
- descriptions off, selected
- captions settings, opens captions settings dialog
- captions off, selected
This is a modal window.
Beginning of dialog window. Escape will cancel and close the window.
End of dialog window.
This is a modal window. This modal can be closed by pressing the Escape key or activating the close button.
(Describer) Title: Welcome to Algebra 1.
Hey, guys. Welcome to Algebra 1. Today's lesson is going to focus on calculating slope when you're given two points on a line. Your knowledge of the coordinate plane and what you learned in pre-algebra will help you get through this lesson. You ready to get started? Let's go.
(Describer) She uses a stylus on a screen.
Okay. Slope, you probably learned in algebra or pre-algebra, is a rate of change; it describes a rate. Often we'll have points in a table. You can interpret the slope or a rate that way. That's how we'll start out, to get your mind warmed up for dealing with slope. "Melissa is training for a marathon. The table below shows a record of her best times." We see, in 15 minutes, she ran 3 miles; 30, she ran 6 miles; 45, she ran 9 miles, okay? So slope or the rate of change-- let's say we wanted to see if it was positive or negative. Is Melissa getting better or not as she's training? Let's see if her distance increases as her time increases. At 15 minutes, she ran 3 miles. When the minutes increase to 30, her miles increase to 6. When the minutes increase to 45, her miles increase to 9. Okay, all right. It looks as though she is increasing. Her rate of change, or in her training, her slope, it's getting better every time. Let's look at this graphically and see what this looks like.
(Describer) On the graph, the x-axis has minutes and the y-axis has miles.
(female narrator) On the graph, the X-axis has minutes, and the Y-axis has miles. If we plotted those points on our coordinate plane-- I got the first quadrant here since things were positive-- we see that it looks like-- if I do just a rough line-- it is increasing. If you look at it graphically, or if Melissa looked at this graphically, she'll see she's doing good and should keep training. As her minutes increase, the miles she runs increases. We'd say the slope here is positive. That's a way we can describe slope, or rate of change. There are four descriptors; let me show you those. The slope of a line can be called positive. Like we read words from left to right-- like when I read "slope," I start at the "S"-- we read graphs left to right. From left to right, this line rises. That's a positive slope. From left to right, this line falls. It has a negative slope. From left to right, there's no change in this line, so we say it's a zero slope. This line doesn't actually go left to right; it goes up and down. This slope is undefined. I'm going to flip back a second. We have a positive slope, a negative slope, zero slope, undefined slope. Those are the four descriptors for slope. Many times, you want to actually get a value. So I'll show you how to get that rise over run, which is also what we describe slope as. Slope is the change in Y...
(Describer) She writes beside a graph with two plot points.
divided by the change in X. Another way we describe that, because the Y axis goes up and down and the X axis goes left to right, is we also say that that is the "rise over the run." When you have to determine the slope of a line from a graph and you want to count out the slope, you'll do this. Start at the point furthest to the left. In this case, this is the point is at (1, 1). I'll count how far I have to rise up, then run over to get to that second point. Write it like a ratio, or a fraction, and that's my slope. I'll start from this point.
(Describer) She counts going up.
I have to rise two to get to the same level as that second point...
(Describer) She counts going across.
and I have to run four to get over to that second point. So my rise was 2, my run was 4. I'd say, "All right, my slope is 2 over 4." Or reduce, because we always like things in simplest form-- slope is one-half, and that's it. That's how you determine the slope from two points that are already on a graph, already plotted for you. Let's try another one. Remember we read from left to right on the graph. The left point, the point that's furthest to the left, is up in the second quadrant, and this second point's down here in the third. Here, I don't have a rise, I have a fall. You can visualize that that line passing through those points has a negative slope. I'll start with that point furthest to the left. You don't have to start with that point, but if you do always start with the point furthest to the left, it's just more likely you won't make a mistake while you count. It'll be easier figure out if a slope is positive or negative if you get in the habit of reading from the left. So we're going to read this graph from the left also. Here, we're going to start with the point furthest left. Here it's a fall; I've got to drop down. So one, two, three, four, five... and I went over one. So if my slope is the rise over run, in this case I had a fall, so I'll say the slope is negative 5 over 1. I could represent that as a whole number because the denominator is 1, and say that my slope is negative 5. Either answer is acceptable. Either one is perfectly fine. Okay, I want you to try this one. Press pause and take a few minutes, and count out the slope for that rise over run. To check your answer, press play.
(Describer) Title: What is the slope? The graph has two plot points. The first is at negative 3, plus 1. The other is at negative 2, negative 1.
(female announcer) What is the slope? The graph has two plot points.
The first is at (negative 3, 1).
The other is at (negative 2, negative 1). Okay, let's see how you did. If you started from that left point, that far left point, we're going to go down one, two. Over one, two, three, four, five. If slope is rise over run, in this case is was a fall, so negative 2 over 5. That would be your slope for this problem, all right? Let's keep going. There's another way that you can determine the slope given two points; let's use this example. "What is the slope of the line "that contains these given points?
(12, negative 2) and (9, 3)?" We could get some graph paper and we could plot these points, okay? Another way to determine the slope of a line is to use the slope formula. Let me show you that. Given two points--and I'll explain these symbols soon-- but the slope, M-- "M" stands for slope-- the slope, M, of a line given points (X sub-1, Y sub-1), and (X sub-2, Y sub-2)-- so that's just saying given two different points-- the slope is M equals Y2 minus Y1 divided by X2 minus X1. That's another way that you could calculate the slope of a line. That's your rise over your run written as a formula. Let me show you how to work this by jumping back to example three. They gave us two points. First thing I'll to do is write the slope formula up here. So M equals Y2 minus Y1 over X2 minus X1. So I'm going to label the first point X1, Y1. I'm going to label the second point X2, Y2. Just labeling it will help you keep everything straight, okay? Now that I have the points labeled, I'm going to use the slope formula. So M equals Y2 minus Y1, so that's 3 minus negative 2... over X2 minus X1. So that's 9 minus 12. And then we're just going to simplify this. You're seeing your numerator, you have that double negative. From pre-algebra you remember that just becomes a plus. So 3 plus 2, that's 5. And 9 minus 12, that's negative 3. The slope of the line that contains these two points, negative five-thirds. It's the same answer if you plotted these points and counted the rise over run. You should be familiar with the slope formula because you may be asked, specifically, to use that method to find the slope. All right, let's try another one. We have (8, 5) and (12, 5). Calculate the slope of the line that contains the given points. I'll write formula up here. So M equals Y2 minus Y1 over X2 minus X1. I'm going to label my points. So (X1, Y1), (X2, Y2). Now let's start substituting. So I need Y2 minus Y1, so that is 5 minus 5... over X2 minus X1, so that's 12 minus 8. So 5 minus 5, that's 0. 12 minus 8, that's 4. 0 divided by 4 is 0. So the slope of this line is 0. If you remember when we looked at the slopes graphically, that's that flat line, that horizontal line. You could get a visual that the line that contains these two points is a horizontal line. All right, let's keep going. And it is your turn. Press pause, take a few minutes to work through these problems. I want you to be comfortable using a slope formula. When you're ready to check your answers, press play.
(Describer) Title: Use the slope formula to find the slope of the line that contains the given points. Number One: The points are negative 1, positive 2, and positive 1, positive 10. Number Two: The points are 7, 3; and 7, 9.
(female narrator) Use the slope formula to find the slope of the line that contains the given points.
Number 1: The points are (negative 1, 2) and (1, 10). Number 2: The points are (7, 3) and (7, 9). All right, let's see how you did. For the first one, the slope of that line that contains those two points... was 4, or maybe you wrote 4 over 1. For number two, the slope of the line that contains those two points is undefined. Okay? All right. Let's look at these to show you the work for these. Let me write the slope formula. Let's get the pen back. So M equals Y2 minus Y1 over X2 minus X1. And I'm going to label my points. So X1, Y1; X2, Y2. Now I'm just going to substitute into the formula. So Y2 minus Y1, that'd be 10 minus 2... over X2 minus X1, so that's 1 minus negative 1. So 10 minus 2, that's 8. 1 minus negative 1, that's going to become a plus. So in other words, 1 plus 1, that's 2. Then, 8 divided by 2 is 4. So the slope of that line is 4. Or visually, that would be a line... that went up, that would rise from left to right. That second one, that one that was undefined. Let's write our slope formula. So Y2 minus Y1 over X2 minus X1. Let's label our points, so X1, Y1; X2, Y2. Now, let's substitute into the slope formula. So Y2 minus Y1, that'd be 9 minus 3 over X2 minus X1, so that'd be 7 minus 7. So 9 minus 3, that's 6. 7 minus 7 is 0. It's not possible to divide any number by 0. If you put 6 divided by 0 in the calculator, you'd probably get an error saying "undefined" or "no domain." That's how I know that this slope is undefined. Don't leave the answer as 6 over 0. Write the answer as "undefined." Remember, the slope of a line that's undefined, or a line with an undefined slope, it's a vertical line, straight up and down. Okay? All right. Great job solving problems involving calculating the slope of a line by counting the rise over run on the graph or using the slope formula. Hope to see you soon for more Algebra 1. Bye!
(Describer) Accessibility provided by the US Department of Education.
Now Playing As: English with English captions (change)
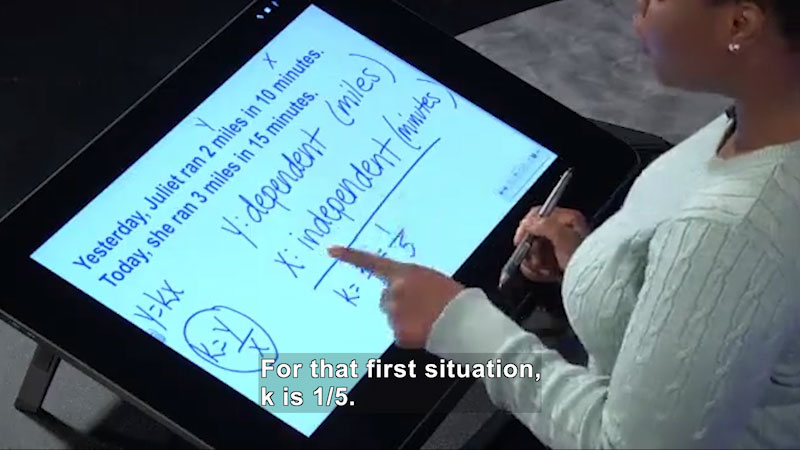
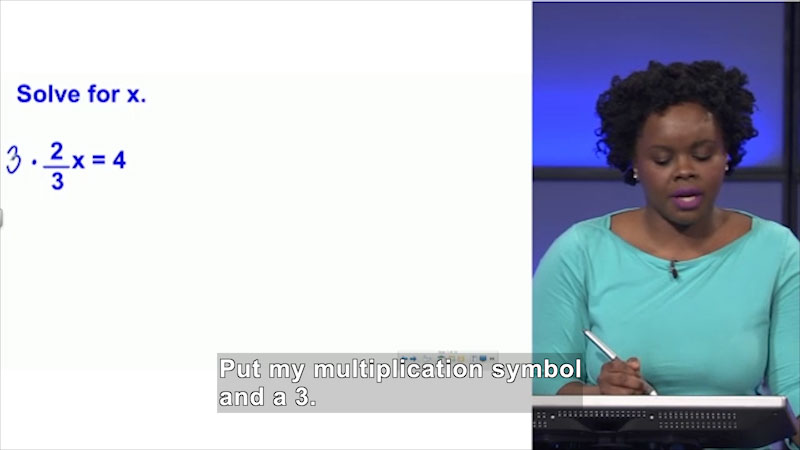
In this program, students will learn about calculating slope when given two points. Students also increase their understanding of the equation y=mx+b. Part of the "Welcome to Algebra I" series.
Media Details
Runtime: 14 minutes 34 seconds
- Topic: Mathematics
- Subtopic: Algebra, Mathematics
- Grade/Interest Level: 7 - 12
- Standards:
- Release Year: 2014
- Producer/Distributor: PBS Learning Media
- Series: Welcome to Algebra I
- Report a Problem
Available Resources
Related Media

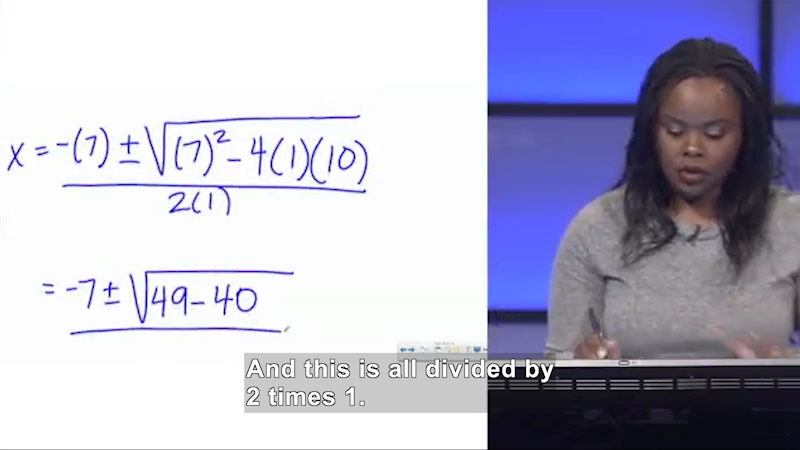
Welcome to Algebra I: Solving Quadratic Equations Algebraically

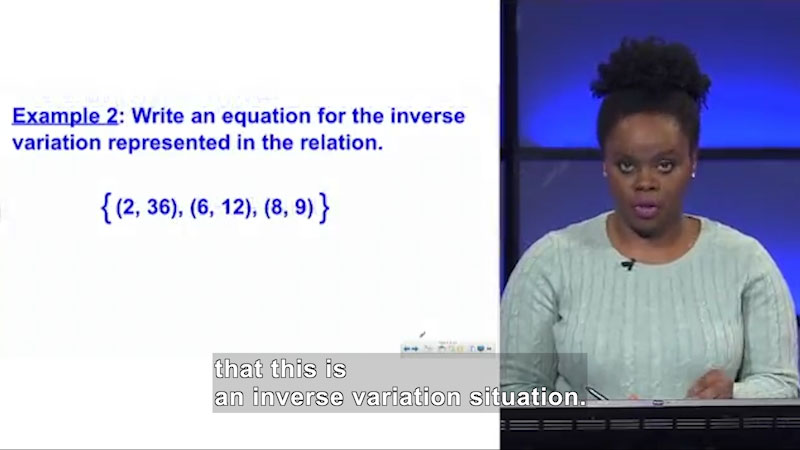
Welcome to Algebra I: Representing an Inverse Variation Algebraically

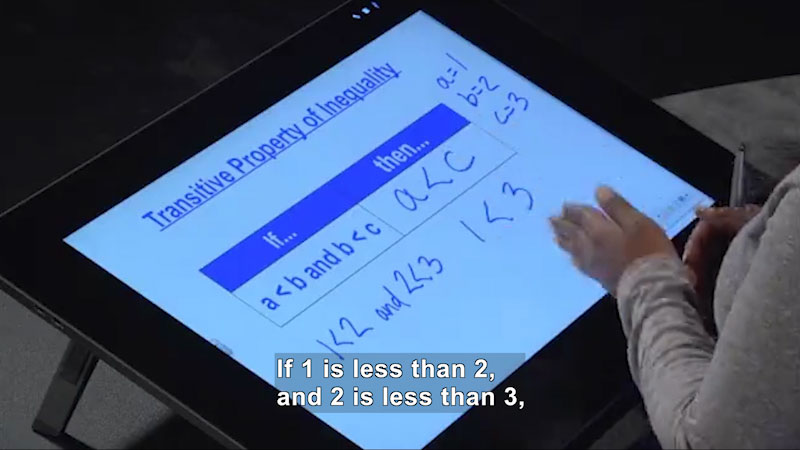
Welcome to Algebra I: Properties of Inequality

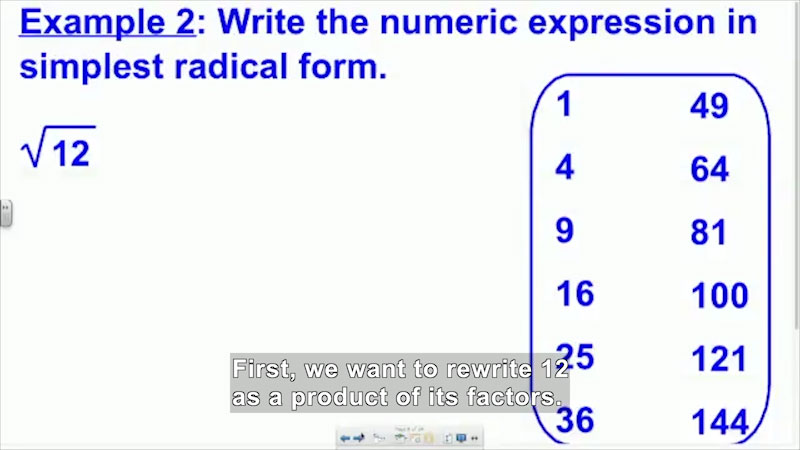
Welcome to Algebra I: Simplifying Square Roots of Whole Numbers

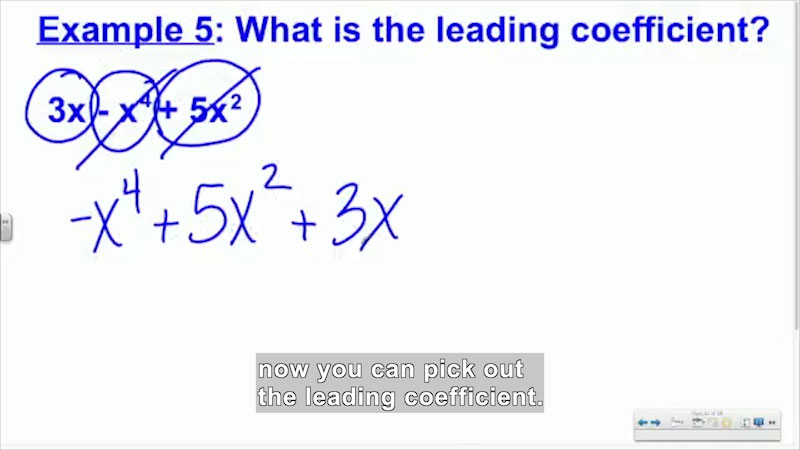
Welcome to Algebra I: Introduction to Polynomials

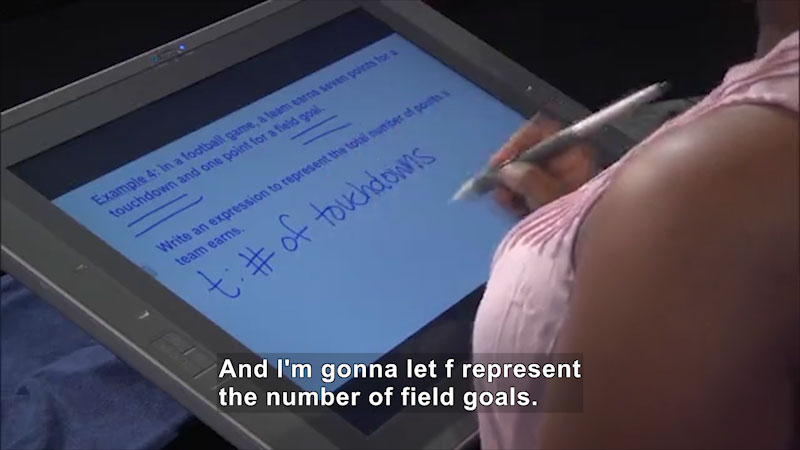
Welcome to Algebra I: Modeling Real-World Situations

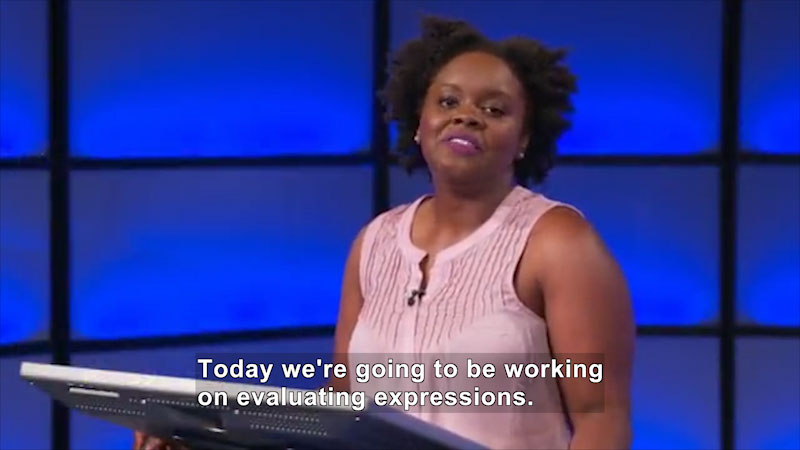
Welcome to Algebra I: Evaluating Expressions

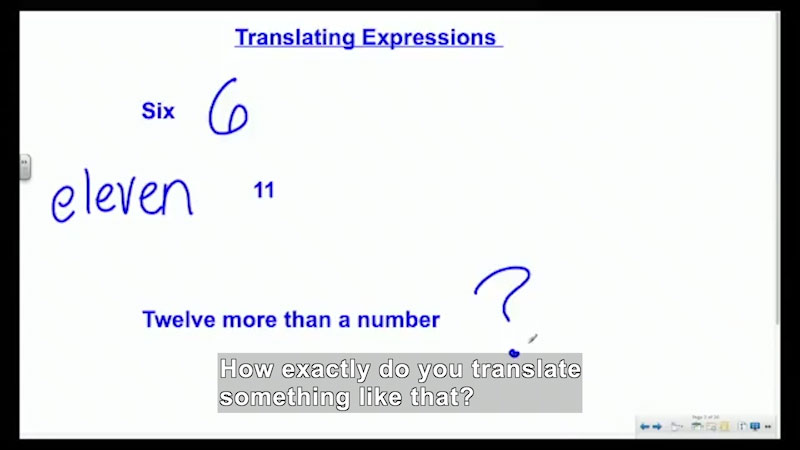
Welcome to Algebra I: Translating Expressions

Welcome to Algebra I: Determining if a Direct Variation Exists

Welcome to Algebra I: Solving Literal Equations